User cloud costs
Navigate to the Cloud costs per user dashboard
From the Grafana homepage, navigate to Home > Dashboards > Cloud cost dashboards and then click on Cloud costs per user.
This will load the dashboard, which may take a few moments to populate with data.
Understand the user costs dashboard layout
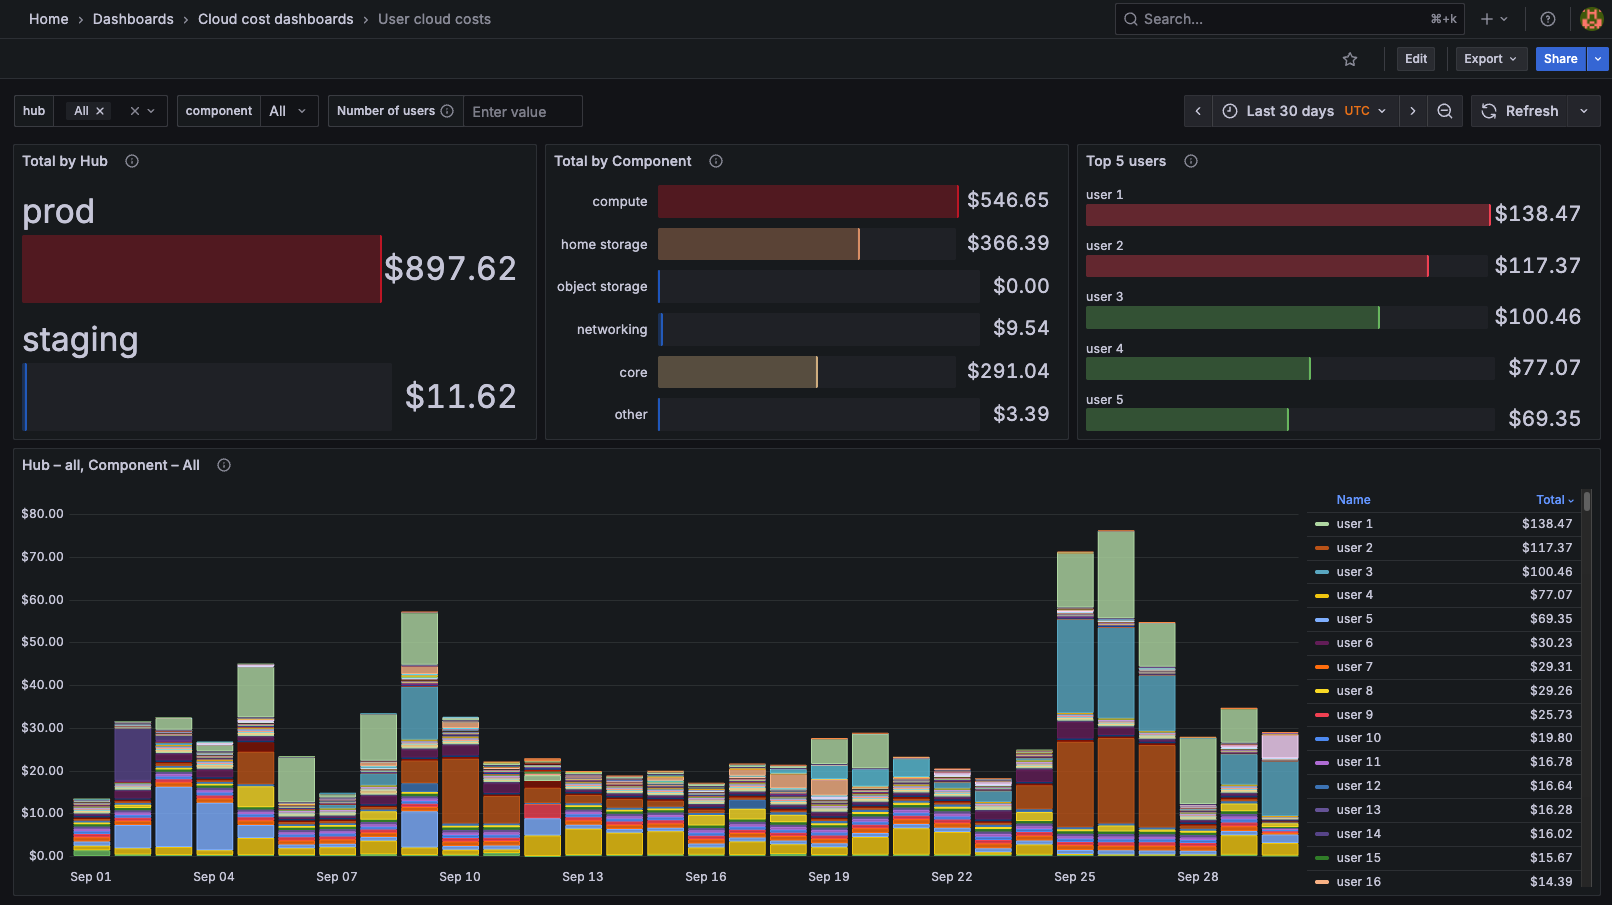
The dashboard is organized into several panels, each providing insights into different aspects of user cloud costs:
Top 5 Users: a quick at a glance view of the top 5 users by total cost over the selected time range.
Total by Hub: a breakdown of total costs by hub, allowing you to see which hubs are incurring the most expenses.
Total by Component: a breakdown of total costs by component, helping you identify which resources are driving costs.
Hub – Component: daily user costs. Sums over all hubs and components are shown by default. Try toggling the variable
hubandcomponentat the top of the dashboard to filter between hubs, or home storage and compute components.
Group cloud costs
Understand the group costs dashboard layout
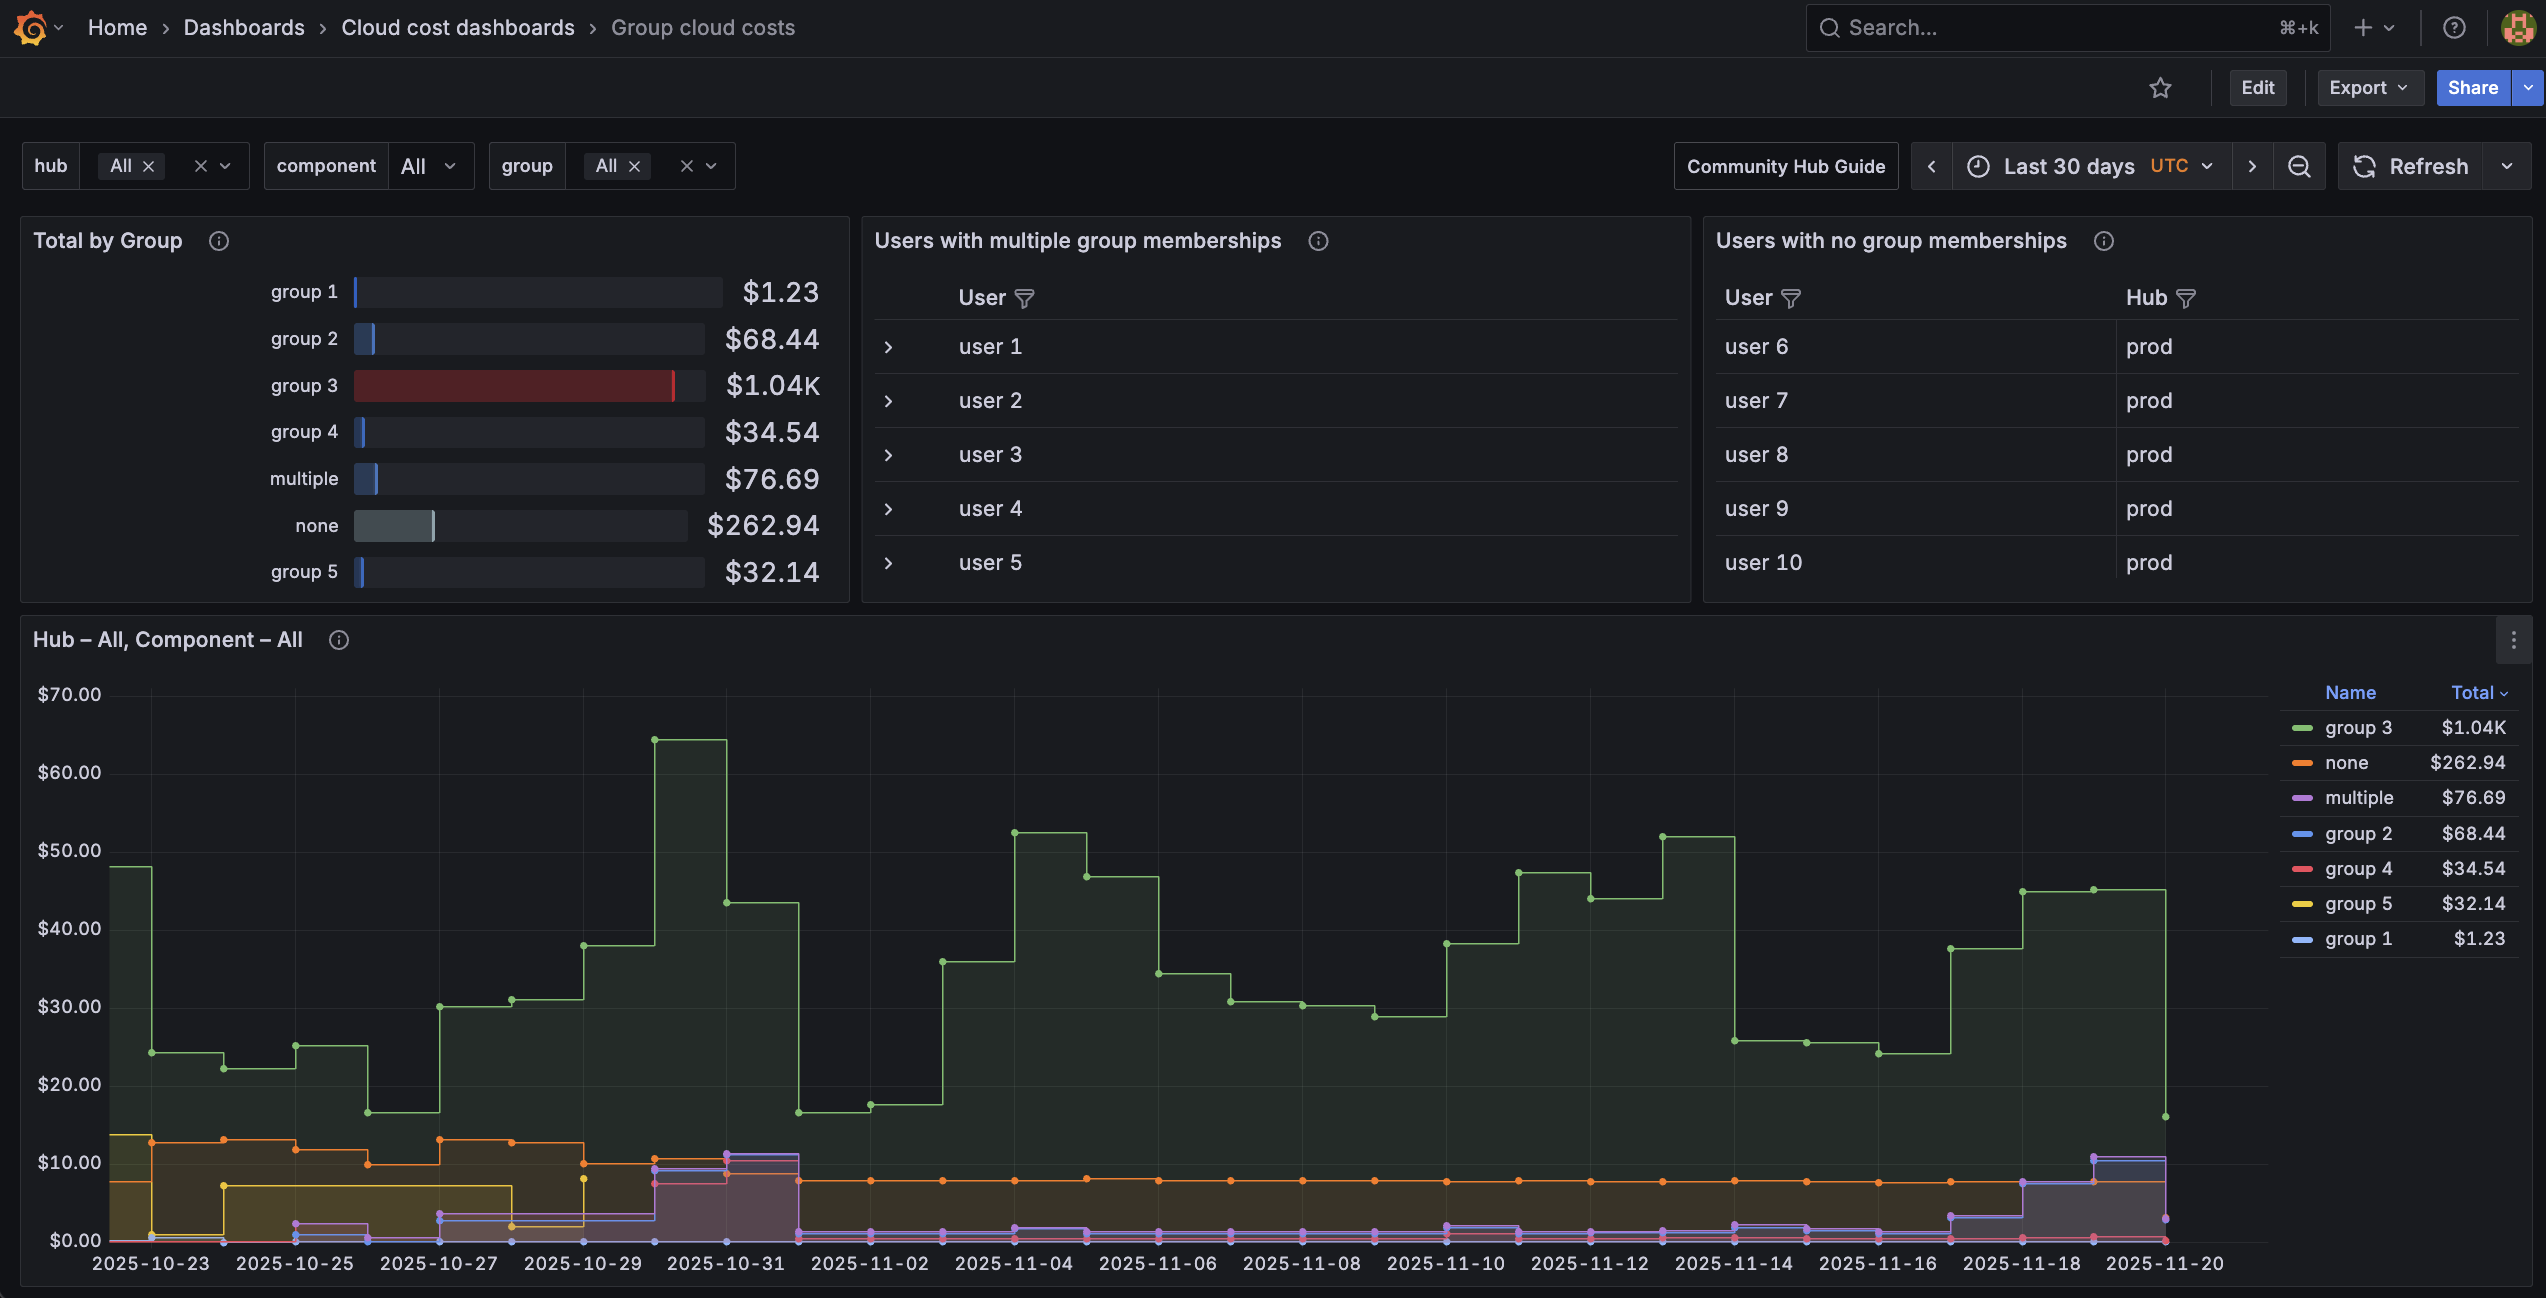
The Group Costs dashboard is organized into the following panels:
Total by Group: a breakdown of total costs by user group, summed over the selected time range.
Users with multiple group memberships: a table of users who belong to more than one group, where their costs are double-counted in group costs.
Users with no group memberships: a table of users who do not belong to any group, where their costs are not attributed to any group.
Hub – Component: daily group costs. Sums over all hubs and components are shown by default. Try toggling the variable
hubandcomponentat the top of the dashboard to filter between hubs, or home storage and compute components.
Interact with the dashboard
You can interact with the dashboards in several ways:
Time Range: use the time range selector in the top right corner to adjust the period for which data is displayed. The last 30 days are shown by default. The timezone is always UTC, since daily cost data prepared by cloud providers is typically settled at 00:00 UTC.
Variables: use the dropdowns at the top of the dashboard to filter data by hub, component or group, or limit number of users displayed.
Legend: click on user names in the legend to isolate or hide specific users in the graphs. You can select multiple users by holding down the
Shiftkey while clicking, and double-click to reset the selection.Tooltips: hover over data points in the graphs to see detailed information, including exact cost values and timestamps of each user.
Export data
You can export the data from any panel by clicking on the panel menu in the top right corner, then selecting Inspect > Data. From there, you can view the raw data and export it in various formats, such as CSV or JSON.
Resources
Grafana is a powerful open source data visualization tool with many features. For more information on how to use Grafana, refer to the Grafana documentation.
Feedback and support
If you have any feedback or suggestions on what works well or how you would like to improve the dashboard design, let us know!